
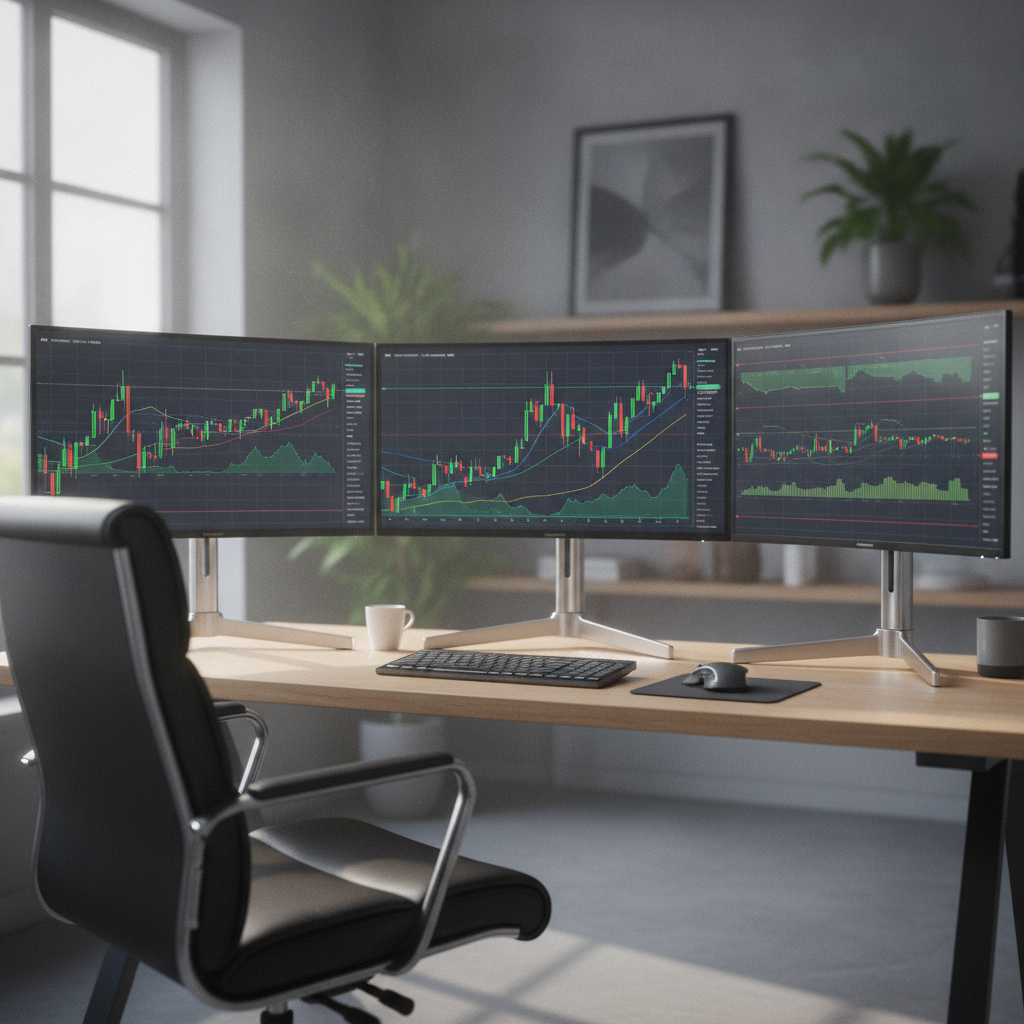
Stock signals are rule-based alerts that suggest potential buy, sell, or hold actions based on objective criteria such as price patterns, volume, and fundamentals. They convert market data into clear entries, targets, and stop-loss levels so you can act with discipline. For traders in India and beyond, stock signals reduce guesswork and support consistent, confident decision-making.
By Hamed Khan, Proxima Learning · Last updated: 2026-06-25
At a Glance
This complete guide explains stock signals, why they matter, and how to use them. You’ll learn key types, a step-by-step workflow, best practices, essential tools, and 13 real examples. Use it to structure entries, targets, and stops with confidence and improve your trading discipline throughout 2026.
Use this section as your quick overview and navigation aid. Skim the bullets, then jump to the part you need.
- What stock signals are and the value they add to your routine
- How signals turn raw data into entries, stops, and targets
- Types of signals: technical, fundamental, sentiment, macro, options
- Step-by-step workflow and a checklist you can copy
- Risk controls: position sizing, risk/reward, exit rules
- Tools and resources used by disciplined traders and investors
- 13 concise examples that show signals in real decisions
What Are Stock Signals?
Stock signals are systematic alerts that identify potential trade or investment opportunities using predefined rules. They compress noisy inputs—price, volume, earnings, volatility—into clear actions: enter, manage, or exit. High-quality signals specify levels (entry, target, stop) and timeframes to improve consistency and reduce emotional mistakes.
In our education and Trading Signals & Alerts programs, signals operate like if-then rules built on measurable thresholds. If price closes above the 200-day moving average, then trend bias is up. If RSI(14) crosses below 30 and then back above it, momentum reversion may be forming. These numeric anchors create repeatable structure you can test over 50–100 trades for statistical confidence.
Why a rules-first approach works
- Rules simplify decisions during fast markets, especially in the first 15–30 minutes after the open.
- Signals align across timeframes (5-minute, hourly, daily) to improve probability and reduce noise.
- Many traders target a minimum 1:2 risk-to-reward ratio per trade to stay net positive despite losing trades.
- Earnings season occurs four times per year; signals adapt to catalyst risk and volatility spikes.
Proxima Learning emphasizes clarity and transparency. We show the logic behind signals, the intended holding period, and what invalidates a setup. That way, you learn the “why,” not just the “what,” and you can replicate the process independently over hundreds of sessions.
Why Stock Signals Matter
Signals turn market noise into a plan. By defining entries, stops, and targets before you click buy, you limit downside, avoid FOMO, and compound discipline. Over ~250 trading days a year, a small edge plus strict risk limits can add up to meaningful performance and lower stress.
Most inconsistent results trace back to two things: vague rules and elastic risk. Signals force definition on both. You know where you’re wrong (the stop), where you’re right (targets), and how you’ll manage the middle (add, reduce, trail). That structure preserves mental capital—often as valuable as financial capital—when conditions turn choppy.
Common pain points these signals solve
- Complexity overload: Too many indicators create contradictory readings. Signals narrow focus to 2–3 core inputs.
- Lack of discipline: Emotional trading widens stops. Predefined exits keep losses small and consistent.
- Late entries: Chasing breakouts hurts win rate. Signals define entries at pullbacks or level retests.
- Unclear position sizing: ATR-based stops and fixed risk-per-trade remove guesswork from share count.
In our experience teaching beginners through advanced traders, a written playbook plus post-trade reviews drives steady improvement. Even reducing two unforced errors per week can protect capital during streaks of elevated volatility or macro uncertainty.
How Stock Signals Work
Signals combine inputs (price, volume, fundamentals) with rules to produce outputs: entry price, stop-loss, targets, and time-in-trade. The engine is objective math—moving averages, RSI, MACD—or events like earnings and breakouts, all translated into repeatable instructions.
Mechanically, every signal has three parts: input, condition, and instruction. For example: Input = 20/50 exponential moving averages plus RSI(14). Condition = bullish when the 20 EMA crosses above the 50 EMA and RSI is above 55. Instruction = buy the first pullback to the 20 EMA; place stop 1 ATR below; target the prior swing high for at least 1:2 risk-to-reward.
- Common parameters: 20/50/200 EMA, RSI(14) at 30/70, MACD 12–26–9, Average True Range for stops.
- Breakouts: 20-day high with volume ≥ 1.5x the 20-day average, confirmed by a strong close.
- Event-driven: Earnings surprise ≥ 5% with guidance change can shift bias for days to weeks.
- Time-in-trade: Intraday (minutes to hours), swing (days to weeks), position (months).
We teach traders to size by volatility, not feelings. If your stop is 1.2 ATR away, your share count adjusts so your per-trade risk stays constant (for example, 1% of equity). That math keeps losing trades small even when price whips around key levels.

Types of Stock Signals (With Comparison)
Most practitioners blend technical, fundamental, sentiment, macro, and options signals. Each shines in a different role: technicals time entries, fundamentals set direction, sentiment gauges crowding, macro defines regime, and options data frames probability and risk.
Use this comparison to decide which inputs to prioritize for your strategy and timeframe.
| Type | Primary Inputs | Best Use | Pros | Watch-outs |
|---|---|---|---|---|
| Technical | EMA 20/50/200, RSI(14), MACD 12–26–9, ATR, VWAP | Timing entries/exits on 5m–daily charts | Objective, backtestable rules | Whipsaws in low-liquidity periods |
| Fundamental | EPS growth %, revenue %, margins, guidance, cash flow | Directional bias over weeks–months | Anchored in business quality | Quarterly cadence can lag price |
| Sentiment | Put/Call ratios, short interest %, fund positioning | Contrarian or momentum confirmation | Flags crowded trades | Data often delayed 1–3 days |
| Macro/Regime | Rates, CPI, PMI, USD, sector rotation | Risk-on vs risk-off exposure | Context for all trades | Event clusters monthly/quarterly |
| Options/Volatility | Implied vol, skew, open interest, expected move | Probability framing and hedging | Defines risk ranges in % terms | Complex; needs precise rules |
How Proxima Learning blends signals
- Education tracks: Start with trend + momentum (EMA + RSI), then add volume and ATR stops.
- Real-time alerts: Entries, targets, and stops are shared with context and holding-period intent.
- Portfolio advisory: Macro regime and fundamentals drive tilt (growth, quality, income) across months.
- Market research reports: Weekly highlights of high-potential setups to review in live sessions.
Whether you’re trading intraday signals or building long-term positions, the blend changes with your objective. Swing traders might emphasize technical timing, while investors weigh fundamentals and macro trends more heavily.
Step-by-Step: Using Signals in Your Plan
Follow this workflow: define your edge, scan, validate across timeframes, plan entry/stop/targets, size by risk, execute with alerts, and review. This sequence reduces errors and increases repeatability across 200–250 trading sessions each year.
- Define your edge: Choose 2–3 core indicators (e.g., EMA 20/50, RSI 14) and one timeframe to master.
- Scan: Filter for 20-day highs with volume ≥ 150% of average, or RSI crossovers with MACD confirmation.
- Validate: Align higher-timeframe trend (weekly above 50/200) with intraday structure (5m/15m higher lows).
- Plan: Entry at pullback to EMA 20; stop 1 ATR below; targets at prior swing highs for at least 1:2 R:R.
- Size: Keep per-trade risk ≤ 1–2% of equity; adjust share count to stop distance.
- Execute: Use alerts; avoid the first 15–30 minutes if volatility exceeds your plan.
- Review: Journal setup quality (1–5), slippage, and rule adherence (Y/N) after each session.
Practical checklist you can copy
- Trend and level confirmed on higher timeframe
- Volume above 20-day average on trigger candle
- Stop defined by ATR or last swing low/high
- Risk-to-reward ≥ 1:2 with clear partial exits
- No major data releases within 5 minutes of entry
- Position size calculated to fixed risk-per-trade
Building this routine into muscle memory is the real edge. Signals are the map; your process is the vehicle that gets you from idea to outcome without costly detours.
Want a faster learning curve? Proxima Learning unites structured courses, real-time Trading Signals & Alerts, and Portfolio Advisory. Learn the rules, receive actionable alerts with entries/targets/stops, and get long-term alignment through regular portfolio reviews.
Best Practices for Safer, Smarter Trades
Codify your rules, respect risk limits, and cut losers quickly. Use a pre-entry checklist, size consistently, and aim for 1:2 risk-to-reward or better. Track weekly metrics—win rate, average gain/loss, and expectancy—to drive continuous improvement across dozens of trades.
Risk controls that protect your equity
- Daily risk cap: Stop trading when total losses hit a predefined multiple of your average risk per trade.
- Correlation guardrails: Limit exposure to 1–2 names in the same sector to avoid clustering risk.
- No averaging down: Respect the stop. When wrong, exit and reassess after fresh structure forms.
- Time windows: Skip trading five minutes before and after major data prints (e.g., CPI or jobs reports).
- Scale management: Take 25–50% partial profits at 1R; trail the balance with EMA or ATR.
General frameworks for planning and risk are useful in many disciplines. For a broad overview of risk planning concepts, see this concise take on risk management tips that echo the “plan first, act second” mindset many traders adopt.
Tools and Resources
Combine education, live signals, and portfolio guidance. Use scanning tools for setups, alerts for timing, and journals for reviews. Proxima Learning’s courses, real-time alerts, market research, and advisory help you apply rules with clarity and ongoing mentorship.
We center on three pillars, delivered online with live sessions and ongoing support:
- Stock Market Education: Structured learning paths from beginner foundations to advanced strategies.
- Trading Signals & Alerts: Real-time entries, targets, and stops—delivered through modern channels to act quickly.
- Portfolio Advisory: Diversification, rebalancing cadence, and regular reviews for long-term alignment.
- Market Research & Reports: Weekly deep dives that spotlight high-potential setups and sector trends.
Workflow tools in other domains also model “wait for signal → then act.” For a technical analogy on signal-driven workflows (non-financial), review this explanation of a wait-for-signal step used in automation; the concept mirrors how traders hold for confirmation before execution.

Case Studies and Examples (13 Scenarios)
These 13 scenarios show how signals translate into decisions. Each notes the setup, rule, and management approach. Adapt the rules to your plan, size consistently, and journal results to refine your edge quality over dozens of trades.
- 20/50 EMA trend pullback: Uptrend on daily; buy first pullback to EMA 20; stop 1 ATR below; target prior swing high for ≥ 1:2 R:R.
- RSI 30 rebound: Daily RSI(14) dips to 28 then closes back above 30; enter next session; stop at recent low; target 50 RSI midpoint.
- MACD signal cross: MACD 12–26–9 crosses up with histogram > 0; scale in 50% on trigger, 50% on backtest of level.
- 52-week breakout: Price clears 52-week high on 2x volume; buy strength; use ATR-based trailing stop.
- Gap-and-go (event): Earnings surprise ≥ 5%; premarket gap > 2%; buy opening range breakout; stop below ORB low.
- Base breakout (Darvas-style): Six-week box forms; buy on box break with volume ≥ 1.5x; stop at mid-box.
- 200 DMA reclaim: After a 10% decline, price reclaims 200 DMA and holds for two sessions; start swing position; add above pivot.
- Relative strength rotation: Sector ETF outperforms for three weeks; buy leading stock on first higher low; stop at last swing.
- Short-interest squeeze: Short float > 15% and volume spike; buy only with higher-timeframe trend; trail aggressively.
- Options expected move: Price stays inside ±1 expected move by Friday; use defined-risk options structure; manage deltas.
- Put/Call extreme: Put/Call ratio > 1.2 at support; fade fear with tight stop; partial at VWAP, partial at prior high.
- Macro risk-off tilt: CPI rising three months; tighten stops to 0.75 ATR and cut position count from five to two.
- Portfolio tilt for stability: Shift 10–20% toward quality dividend names during earnings volatility; reduce beta temporarily.
Different markets exhibit different rhythms, but the rules-first idea travels well. For a broad perspective on participating in active markets, you can skim this overview on trading opportunities as a reminder to define setups and stick to a plan—regardless of venue.
Key Takeaways
Keep rules simple, size by volatility, and review every week. A consistent workflow—scan, validate, plan, size, execute, review—reduces errors and compounds discipline. Blend technical timing with fundamental and macro context to stay aligned with both trend and risk.
- Write a one-page playbook for each setup with pictures and parameters.
- Use 2–3 complementary indicators and one primary timeframe to avoid noise.
- Target ≥ 1:2 risk-to-reward; respect stops and daily risk caps.
- Measure expectancy over 50–100 trades before changing rules.
- Blend signals: technicals for timing, fundamentals/macro for direction.
Frequently Asked Questions
Traders ask how to read signals, combine indicators, and manage risk. Keep rules simple, test one change at a time, and journal results. When in doubt, reduce size and extend your holding period until your metrics stabilize and confidence returns.
What makes a stock signal reliable?
Reliability improves when rules are specific, simple, and tested across at least 50–100 trades. Look for confluence: trend direction, level, and volume. A minimum 1:2 risk-to-reward with a clearly defined stop keeps one loss from erasing several wins.
Should I use multiple indicators for one signal?
Use 2–3 complementary indicators to avoid overfitting. A common trio is EMA 20/50 for trend, RSI(14) for momentum, and ATR for stop distance. More than three often adds noise and creates conflicting messages.
How do risk limits fit into signals?
Set a daily loss cap and a per-trade limit (for example, 1–2% of equity). Signals define entries and exits; risk limits define when to stop trading for the day to preserve capital and mental bandwidth.
Do signals work for long-term investors?
Yes—use weekly or monthly charts and fundamental triggers. Examples include multi-year EPS growth trends, margin expansion, or a 200-week moving average reclaim. The holding period can span months, but the logic—rules first, emotions second—stays the same.
Conclusion
Stock signals provide a practical framework to trade with discipline. Define your rules, manage risk tightly, and review weekly. With a consistent workflow, you’ll reduce errors, protect downside, and give winners room to work across hundreds of sessions.
- Keep rules simple: 2–3 indicators, 1–2 timeframes.
- Size for survival: risk ≤ 1–2% per trade; aim for ≥ 1:2 R:R.
- Review 10–20 trades at a time before making changes.
Ready to build a rules-based plan? Proxima Learning unifies structured courses, real-time Trading Signals & Alerts, Market Research & Reports, and Portfolio Advisory so you can apply stock signals with clarity and ongoing support.