
Technical indicators are formulas applied to price and volume data to quantify trend, momentum, volatility, and market strength. They turn charts into objective signals that guide entries, targets, and stop-losses. For traders in Hyderabad, Telangana learning these tools through Proxima Learning’s structured programs helps convert noise into disciplined, repeatable decisions.
By Proxima Learning • Last updated: June 22, 2026
Above-Fold: Hook + Quick Navigation
Use technical indicators to read markets faster and act with discipline. This guide explains the core math, the signals that matter, and how to connect them to risk management. Jump to any section below and start applying a rule-based plan on your next session.
- Overview
- What Are Technical Indicators?
- Why They Matter
- How They Work
- Types and Approaches
- Best Practices
- Tools and Resources
- Case Studies and Examples
- FAQ
- Conclusion
Overview
This overview maps indicator categories to trading goals: identify trend, gauge momentum, measure volatility, and confirm strength. You’ll learn how to combine signals into a plan with defined entries, targets, and stop-losses—and how Proxima Learning’s education and alerts help you practice consistently.
Here’s what you’ll learn and apply today:
- Trend: Moving Averages (20, 50, 200), Ichimoku cloud bias.
- Momentum: RSI (14), Stochastics (14,3,3), MACD (12-26-9).
- Volatility: ATR (14), Bollinger Bands (20, 2σ), Keltner Channels.
- Strength & Breadth: Volume profiles, On-Balance Volume, market breadth checks.
- Risk & Execution: 1–2 ATR stops, 1:2+ risk/reward, partial exits.
What Are Technical Indicators?
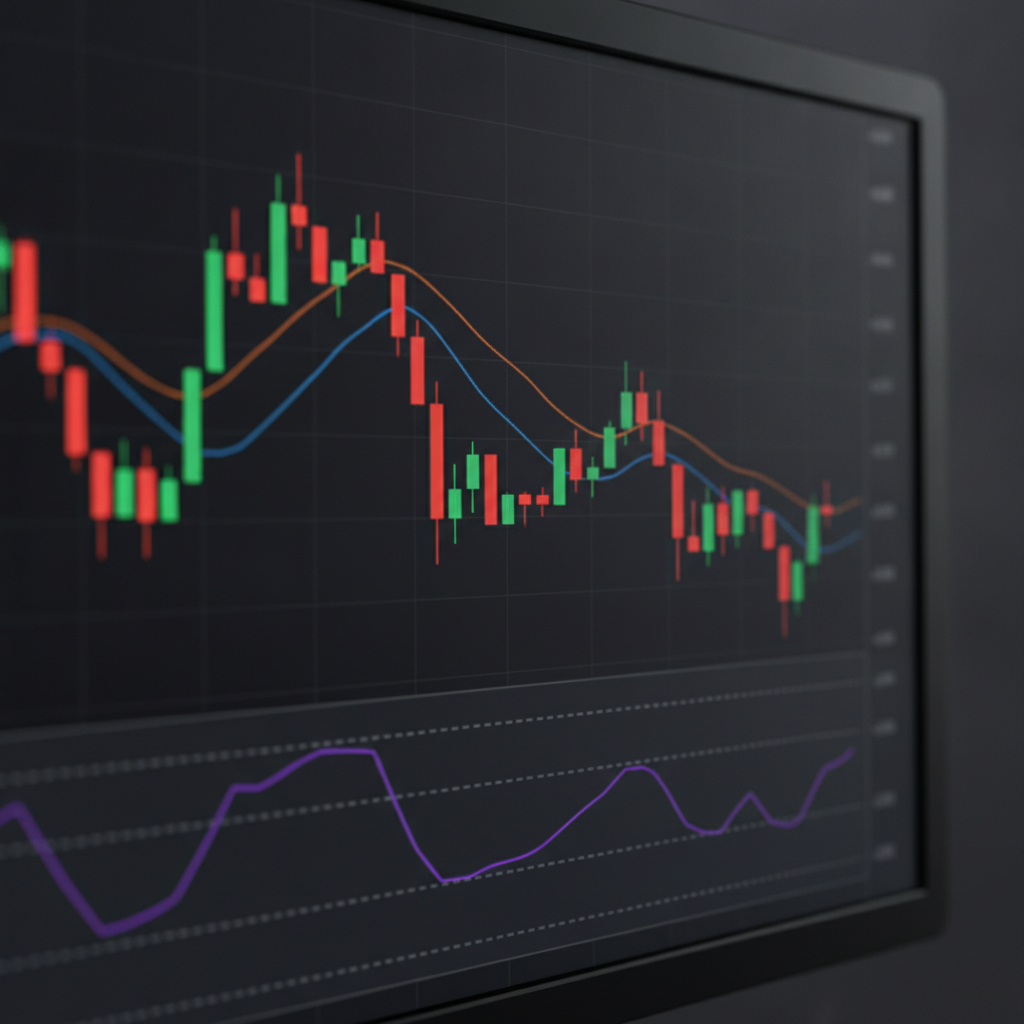
Technical indicators are quantitative calculations—such as averages, ratios, and oscillators—derived from price and volume. They summarize market behavior into signals that help you time entries, manage risk, and standardize decisions across intraday, swing, and position trading.
Why this matters: raw candles can be noisy. Indicators transform that noise into measurable context:
- Trend direction: Uptrends often ride above a rising 50-day SMA; downtrends below.
- Momentum extremes: RSI near 70 suggests overbought risk; near 30 suggests oversold risk.
- Volatility regimes: ATR expansion warns of wider stops; contraction favors breakouts.
- Strength confirmation: Rising price on rising volume indicates healthier demand.
In Proxima Learning’s stock market education tracks, beginners first master a “core four” set—20/50 EMAs, RSI(14), MACD(12-26-9), and ATR(14)—before adding complexity. That sequence reduces confusion and speeds up pattern recognition.
Why Technical Indicators Matter
Indicators create a shared, rules-based language. They reduce emotional decisions, improve risk discipline, and enable faster post-trade reviews. For retail traders, this structure is the difference between random outcomes and a repeatable edge.
Here’s what most traders struggle with—and how indicators help:
- Clarity: 20/50/200 MAs instantly frame trend and bias on any timeframe.
- Timing: RSI divergences often precede momentum shifts; MACD crossovers refine entries.
- Risk: ATR-based stops scale with volatility (e.g., 1.0–1.5 × ATR), preventing too-tight exits.
- Consistency: The same setup rules apply to a 5‑minute or daily chart, aiding discipline.
- Review: Numeric signals make journaling objective—e.g., “RSI 65 to 72, MACD rising.”
Proxima Learning complements theory with real-time trading alerts (entries, targets, and stop-loss levels), so you can see rule-based execution during live sessions and compare with your plan afterward.
How Technical Indicators Work
Indicators compress historical price/volume into formulas: averages smooth trend, oscillators measure momentum, and bands quantify volatility. You then translate readings into rules—for example, enter on a pullback to the 20 EMA with RSI rising and set a 1.5 × ATR stop.
Indicator math, made practical
- Moving Averages (MA): SMA is the arithmetic mean; EMA weights recent data more. Common anchors: 20, 50, 200.
- MACD (12-26-9): Difference between 12- and 26-EMA; 9-EMA signal line. Crossovers and histogram slope matter.
- RSI (14): Bounded 0–100; 70/30 overbought/oversold levels; look for range shifts (40–80 bull, 20–60 bear).
- Bollinger Bands (20, 2σ): Mean reversion signals on band tags; squeeze indicates volatility contraction.
- ATR (14): Average true range; converts volatility into distance for stops and position sizing.
Signal-to-trade checklist (example)
| Step | Rule | Why it helps |
|---|---|---|
| 1 | Trend filter: Price above rising 50 EMA | Trade with the primary bias; reduces fade attempts in strong trends. |
| 2 | Trigger: Pullback to 20 EMA + RSI rebounds through 50 | Aligns entry with momentum resumption, not just price location. |
| 3 | Risk: Stop 1.5 × ATR below swing low | Accounts for volatility so normal noise won’t stop you out. |
| 4 | Targets: Partial at 1 × risk; trail under rising 20 EMA | Lock some gains early; keep a runner for trend continuation. |
| 5 | Review: Note indicator states (e.g., MACD rising, RSI 55→62) | Creates objective logs that feed continuous improvement. |
Common pitfalls (and fixes)
- Lag frustration: MAs confirm after the move. Fix: Use EMA(20) for triggers and SMA(50/200) for bias.
- Indicator overload: More isn’t better. Fix: Master a core four, then add one tool per quarter.
- False signals: Sideways markets whipsaw. Fix: Require a volatility filter (ATR rising or BB squeeze break).
- Timeframe mismatch: A 5‑minute buy vs daily downtrend. Fix: Align to higher timeframe bias first.
Types/Methods/Approaches
Group indicators by what they measure: trend (MAs, Ichimoku), momentum (RSI, Stochastics, MACD), volatility (ATR, Bollinger), volume/strength (OBV, VWAP), and price structure (Fibonacci). Mix one per category to avoid redundancy and build a clean, confirmatory stack.
Trend indicators
- Simple/Exponential MAs: 20 for rhythm, 50 for swing bias, 200 for regime. Golden/death crosses (50/200) mark transitions.
- Ichimoku Cloud: Cloud color and price vs cloud define bias; Tenkan/Kijun crosses refine timing.
- Supertrend/Parabolic SAR: Trailing stop overlays that help manage runners in strong trends.
Momentum oscillators
- RSI (14): Focus on range shifts: bull (40–80), bear (20–60). Divergences hint at exhaustion.
- Stochastics (14,3,3): Useful in ranges; buy near 20, sell near 80 with trend context.
- MACD: Slope and histogram expansion often precede price acceleration.
Volatility measures
- ATR: Position size and stops scale with ATR (e.g., 1.0–2.0 × ATR).
- Bollinger Bands: Mean reversion at bands; “squeeze” breakouts after contraction.
- Keltner Channels: ATR-based envelopes; BB squeeze vs KC expansion combo is a favorite.
Volume and strength
- VWAP: Intraday mean; institutions often reference it. Price above VWAP signals bullish session bias.
- On-Balance Volume: Confirms if volume trends with price; divergence can warn of weakness.
- Volume Profile: Shows high-volume nodes (HVNs) and low-volume nodes (LVNs) for support/resistance.
Price structure tools
- Fibonacci retracements: 38.2%, 50%, 61.8% levels align with pullbacks within trends.
- Extensions: 127.2%, 161.8% for mapping targets after breakouts.
- Market structure: Higher highs/lows (HH/HL) vs lower highs/lows (LH/LL) confirm bias.
| Indicator | Primary Signal | Best Used When | Typical Settings |
|---|---|---|---|
| EMA/SMA | Trend direction | Trending markets | 20/50/200 |
| RSI | Momentum extremes | Both trends and ranges | 14, 70/30 lines |
| MACD | Momentum shifts | Trend pullbacks | 12-26-9 |
| Bollinger Bands | Volatility/mean reversion | Range trading, squeeze setups | 20, 2σ |
| ATR | Stop/size calibration | All conditions | 14, 1–2 × ATR |

Best Practices
Build a small, non‑overlapping stack (trend + momentum + volatility), define rules, and journal rigorously. Trade with higher‑timeframe bias, size by ATR, and avoid indicator overload. Consistency beats complexity.
Practical guardrails we teach in Proxima Learning’s programs:
- Stack design: 20/50 EMA (trend), RSI(14) (momentum), ATR(14) (risk). Optional: Bollinger(20,2) or VWAP.
- Top‑down alignment: Higher timeframe sets bias; trade with it unless a proven counter-trend system.
- Risk-first: Position size from stop distance (e.g., 1.5 × ATR). Favor 1:2 or better reward/risk.
- One change at a time: Modify only one variable per week to isolate impact.
- Transparent methodology: Document data sources and rules clearly, similar to this report sources overview used in large-scale trend reports.
Local considerations for Hyderabad
- Sessions can be active near India market opens; plan indicator checks around your morning routine in Hyderabad.
- Earnings and holiday calendars can compress or expand volatility; adjust ATR-based stops during festival weeks in Telangana.
- For community support, align your practice windows with Proxima Learning’s live sessions so signals match local timing.
Execution habits that compound
- Pre‑market map: Mark yesterday’s high/low, overnight range, key MAs, and VWAP.
- First hour discipline: Wait for confirmation—e.g., RSI > 50 and price reclaim 20 EMA before entries.
- Data hygiene: If feeds drop, pause. Don’t trade on missing candles.
- Post‑trade journaling: Record indicator states and outcomes; tag setups by type.
Want a second set of eyes? Proxima Learning’s trading signals and alerts provide clear entries, targets, and stop-loss levels you can compare with your plan to speed up learning loops.
Tools and Resources
Choose charting that’s stable and fast, add reliable data feeds, and use a journal that captures indicator states. Combine this stack with live education and alerts to close the loop from plan to execution to review.
- Charting software: Prioritize performance, multi-timeframe layouts, and custom indicator parameters.
- Data feeds: Real-time equities/derivatives with minimal latency; verify pre/post-market coverage.
- Journaling tools: Templates that log EMA slope, RSI value, MACD state, ATR and stop distance.
- Education: Proxima Learning’s beginner-to-advanced courses on technical analysis, psychology, and risk.
- Live practice: Live trading sessions to watch signal execution and ask questions in real time.
- Market research: Reports that track sector momentum, breadth, and macro calendars.
- Method transparency: Archive rules and sources—see an example of methodology assets in this methodology assets reference.
Trends aren’t only in markets; they’re present in many domains. Reviewing cross‑industry trend studies, like this trend predictions article, can sharpen how you frame “regimes,” “cycles,” and “inflection points.” The language of change is universal.
Mid-article invitation: practice with mentors
Want hands-on feedback on your indicator stack? Join a Proxima Learning live session to see entries, targets, and stop-losses applied in real time, then review your journal with our mentors.
- Structured walkthroughs of RSI, MACD, and ATR in multiple timeframes
- Real-time trading alerts you can mirror in a simulator
- Portfolio advisory for aligning swing trades with long-term goals
Case Studies/Examples
These real-world scenarios show how a small, consistent indicator stack helps you act decisively and review objectively. Each example highlights entries, stops, targets, and the journal notes we’d expect from disciplined traders.
Intraday momentum: EMA + RSI + VWAP
Context: Large‑cap stock gaps up on earnings. On a 5‑minute chart, price reclaims VWAP, rides the EMA(20), and RSI shifts from 45 to 60.
- Entry: Reclaim of VWAP + pullback tag of EMA(20); RSI crosses back above 50.
- Stop: 1.2 × ATR below swing low.
- Targets: 1R partial exit; trail under rising EMA(20) for the runner.
- Journal: Bias with 50 EMA rising; RSI 52→64; MACD histogram expanding.
Lesson: Momentum confirmation (RSI range shift + MACD slope) avoids early fades.
Swing pullback: 50 EMA + RSI(14) + Fib 38.2%
Context: Sector leader in a weekly uptrend pulls to the 50‑day EMA near the 38.2% Fibonacci retracement. RSI(14) holds the 40–50 bull range.
- Entry: Bullish reversal candle at 38.2%/50 EMA confluence; MACD rising.
- Stop: 1.5 × ATR under swing low.
- Targets: Prior high, then 127.2% extension; partials along the way.
- Journal: Weekly HH/HL intact; OBV confirms; ATR stable.
Lesson: Confluence (EMA + Fib + RSI range) increases probability and defines risk clearly.
Breakout from contraction: BB squeeze + KC expansion
Context: Daily Bollinger Bands (20, 2σ) contract as Keltner Channels narrow. Volume dries up at a shelf support.
- Entry: Break and hold above upper band with volume expansion.
- Stop: 1.0 × ATR under breakout level.
- Targets: Measure height of the base; trail with Supertrend to ride expansion.
- Journal: BB width percentile low; MACD turns positive; RSI climbs through 55.
Lesson: Volatility contraction precedes expansion; plan sizing before the break.
Portfolio lens: indicators meet fundamentals
Context: Long-term investor uses Proxima Learning’s portfolio advisory. Fundamentals screen a diversified basket; 200‑day SMA filters trend; ATR sets rebalance bands.
- Allocation rule: Trim above band, add at Fib 38.2% pullbacks when 200‑SMA slope is positive.
- Risk: Keep single‑position exposure capped; use 1:3+ payoff thresholds.
- Review: Quarterly check of SMA slope, sector breadth, and earnings calendar.
Lesson: Simple technical rules improve timing even in fundamentally led portfolios.
Frequently Asked Questions
Get quick, direct answers to common indicator questions so you can apply the concepts immediately without second‑guessing.
What are the best technical indicators for beginners?
Start with a small stack: 20/50 EMAs for trend, RSI(14) for momentum, and ATR(14) for stop distance and sizing. Add MACD to visualize momentum shifts. These settings are standard across platforms, easy to read, and work on intraday and daily charts.
How many indicators should I use at once?
Use three to five non‑overlapping tools: one trend, one momentum, one volatility, plus an optional volume and price-structure tool. More indicators often add conflicting signals and slow execution. Consistency with a small set beats complexity.
Do indicators work in all markets and timeframes?
The math works everywhere, but edge depends on market regime and your rules. Use a higher‑timeframe bias filter, then apply your setup on the execution timeframe. Tighten or widen stops with ATR as volatility changes.
Are indicators lagging or predictive?
All indicators summarize past data, so they’re inherently lagging. That’s fine—rules based on trend, momentum shifts, and volatility can still produce a repeatable edge. Reduce lag by using EMAs and momentum slopes rather than only crossovers.
Conclusion and Next Steps
Keep it simple: one trend tool, one momentum read, one volatility measure. Define rules, size by ATR, and journal aggressively. Then iterate—slowly. With education, alerts, and portfolio guidance, Proxima Learning helps you build a durable indicator‑driven edge.
Key takeaways
- Technical indicators convert price/volume into actionable entries, targets, and stops.
- Core defaults work: EMA(20/50), RSI(14), MACD(12‑26‑9), ATR(14), and BB(20,2).
- Align to higher‑timeframe bias; size positions by 1.0–1.5 × ATR with ≥1:2 payoff.
- Journal numeric states to speed up reviews and remove emotion.
- Practice live with mentors to compress your learning curve.
Ready to turn a few core indicators into a disciplined plan? Book a discovery session with Proxima Learning in Hyderabad and see how our education, real-time signals, and portfolio advisory connect theory to execution.