
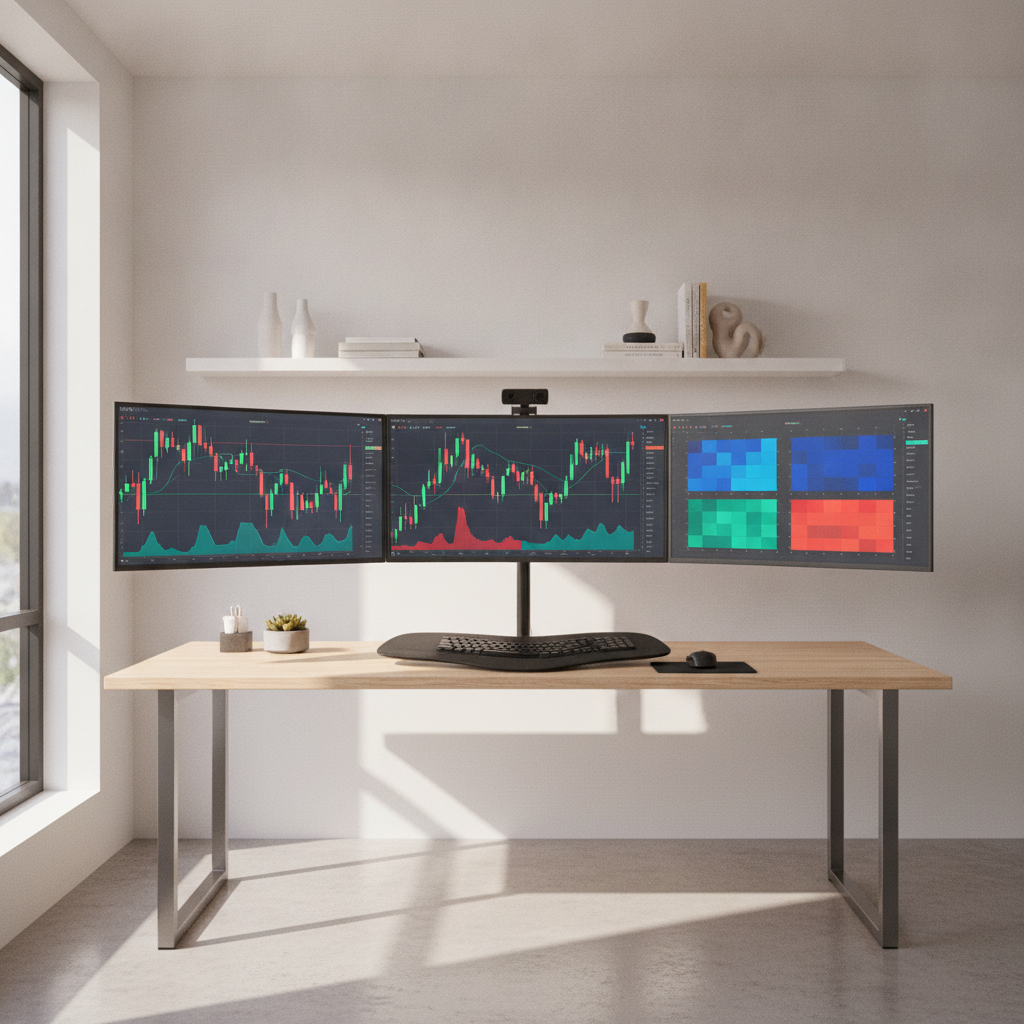
Trading signals are rule-based buy or sell prompts generated from technical, fundamental, or quantitative criteria. They define entries, targets, and stop-losses to standardize decisions. For retail traders in India and beyond, consistent use of signals reduces noise, improves timing, and makes risk management measurable in day-to-day trading.
By Hamed Khan — Proxima Learning
Last updated: June 30, 2026
Quick Summary
This guide explains what trading signals are, why they matter, how they work, and how to use them responsibly. You’ll see common signal types (intraday, swing, options), risk rules, tools, and examples from Proxima Learning’s education, alerts, and portfolio advisory to help you act with discipline and clarity.
- What you’ll learn: core concepts, signal mechanics, risk rules, and execution checklists.
- Why it matters: standardized entries and exits help reduce hesitation and overtrading.
- How we help: Proxima Learning offers structured courses, real-time alerts, and portfolio reviews.
- Use now: define risk per trade, confirm with a multi-factor checklist, and log outcomes.
- Table of contents
- What Are Trading Signals?
- Why Trading Signals Matter
- How Trading Signals Work
- Types of Trading Signals
- Best Practices
- Tools and Resources
- Case Studies and Examples
- FAQ
- Conclusion & Next Steps
What Are Trading Signals?
Trading signals are predefined rules that trigger potential buy or sell actions with clear entry, target, and stop-loss levels. They convert complex market analysis into repeatable steps, helping traders avoid emotional decisions and capture opportunities with consistent, testable criteria.
At Proxima Learning, signals are educational and actionable. We teach how to build them and, where appropriate, share alerts that include the exact levels you need to plan a trade: entry zone, initial stop-loss, and one or more profit targets.
- Definition in practice: a signal is a “setup + trigger + risk plan.”
- Setup: conditions you want (trend, pattern, volume, valuation).
- Trigger: the event that says “go” (breakout, cross, catalyst).
- Risk plan: position size, stop-loss, and profit-taking rules.
- Education first: Our beginner trading courses cover foundations before you touch live alerts.
- Actionable levels: Our alerts specify entry, target, and stop-loss—no guessing.
- Reviews: Portfolio advisory includes periodic reviews to improve signal use over time.
Want a deeper dive into the broader topic? See our pillar overview of stock signals for how signal design fits into overall strategy.
Why Trading Signals Matter
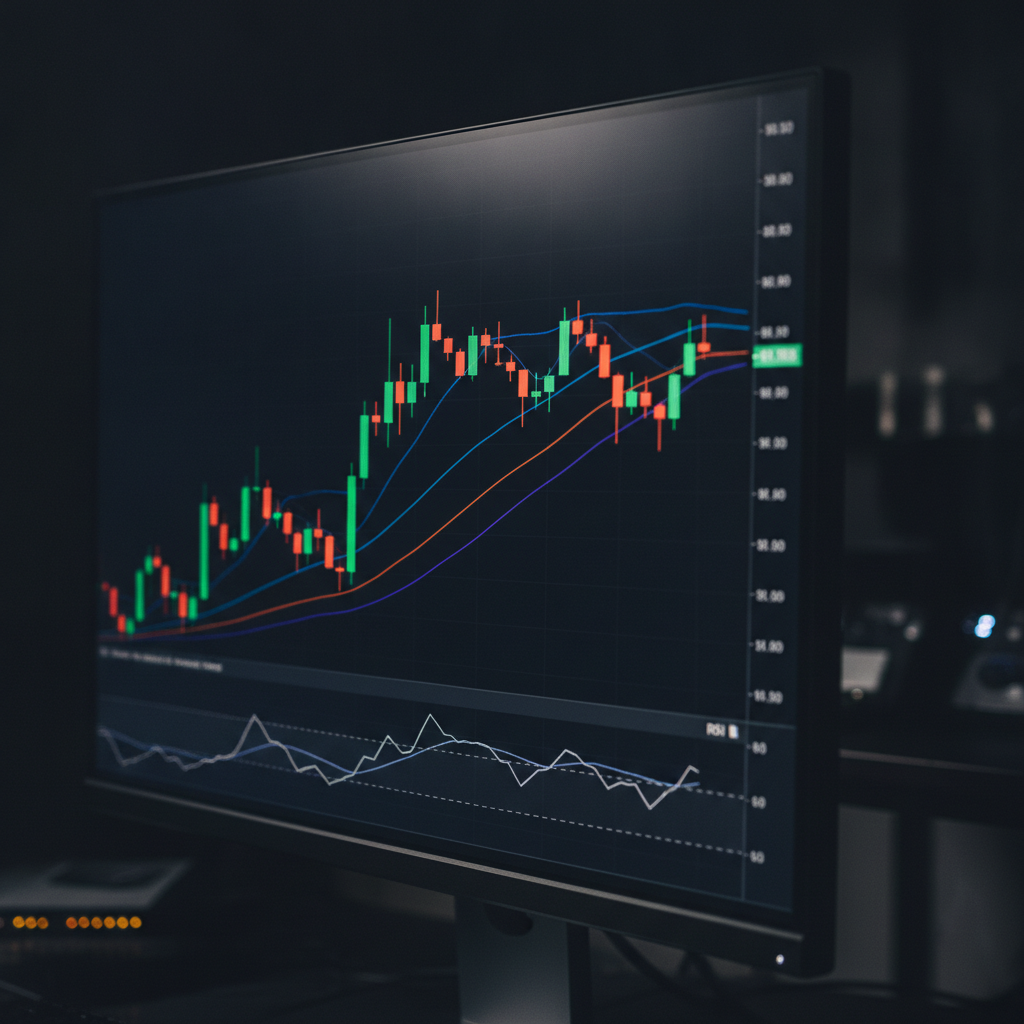
Signals add structure and discipline. By defining entries, exits, and risk in advance, they reduce hesitation, curb overtrading, and align actions with your plan. The net effect is fewer impulsive trades and a more measurable path to consistency.
Here’s the thing: most performance swings come from inconsistent behaviors, not lack of indicators. Signals make you decide in advance what counts as an opportunity and how much you’ll risk.
- Clarity: preplanned levels remove “should I?” debates at the worst moment.
- Risk control: capping risk per trade at about 0.5%–1.0% of equity helps longevity.
- Repeatability: the same checklist every time improves feedback quality.
- Focus: you avoid chasing noise and stick to A+ setups.
- Quantifiable targets: aim for at least 1:2 risk-to-reward; log your R-multiples.
- Cycle awareness: expect win rates in the 40–60% band for many trend and breakout systems; the edge comes from payoff ratio and discipline.
- Training effect: 30–90 days of consistent logging forms habits you can trust under pressure.
In our experience working with developing traders, once a rules-based approach is in place, drawdowns become shallower and recovery faster—because mistakes get identified and retired, not repeated.
How Trading Signals Work
Signals translate multi-factor analysis into a go/no-go decision. You define conditions, wait for a trigger, and size the position based on risk. The workflow blends screening, confirmation, and execution—then closes the loop with journaling and review.
Think of signal execution as a pipeline that runs the same way each time. This consistency is the real edge—not a magical indicator.
Signal workflow (end-to-end)
- Screen: shortlist names using technical filters (trend strength, ATR) and/or fundamentals (EPS growth, margins).
- Pre-plan: define entry, invalidation point, targets, and position size before the open.
- Trigger: wait for objective confirmation (breakout, cross, catalyst).
- Execute: place orders; automate brackets where possible.
- Manage: trail stops or scale out at 1R, 2R, etc.
- Journal: capture setup type, rationale, and emotions; tag outcomes.
- Review: weekly/monthly metrics—win rate, average R, drawdown, and expectancy.
Signal-driven systems are common beyond finance too—software uses similar patterns to wait for events before launching workflows. For a conceptual parallel, see this overview of signal-driven workflows.
| Stage | Input | Decision | Output | Metric |
|---|---|---|---|---|
| Screen | Trend + volatility | Is setup A+? | Watchlist of 10–20 | Quality score (1–5) |
| Plan | Entry/stop/targets | Risk ≤ 1% | Order ticket ready | R multiple potential |
| Trigger | Breakout/confirm | Go/No-Go | Order placed | Slippage (bps) |
| Manage | Trail/scale | Follow plan | Partial exits | Avg. hold time |
| Review | Journal data | Refine rules | Playbook vNext | Expectancy |
Our technical analysis explained article shows how to choose filters and triggers that fit your personality and routine.

Types of Trading Signals
Common signal families include intraday (minutes to hours), swing (days to weeks), and options (directional and income). Each uses specific inputs, timeframes, and risk plans. Matching signal type to your schedule and temperament is the key to sticking with it.
Intraday signals (speed and precision)
- Timeframe: 1–15 minute charts; hold minutes to hours.
- Inputs: opening range, VWAP, momentum bursts, liquidity.
- Risk: tighter stops; slippage matters; risk ≤ 0.5% typical.
- Use case: active screen time; rapid feedback loop.
We share day-ready ideas in trading signals for today when conditions align with our playbook.
Swing trading signals (let trends breathe)
- Timeframe: 1–4 hour or daily charts; hold days to weeks.
- Inputs: breakouts, pullbacks to the 20/50 EMA, volume thrusts, RS lines.
- Risk: wider stops; smaller size; 1:2 or better payoff goal.
- Use case: part-time traders; fewer, higher-quality decisions.
Options signals (flexibility and structure)
- Directional: debit spreads or calls/puts aligned with the chart.
- Income: credit spreads when implied volatility is elevated.
- Risk map: defined max loss; Greeks awareness; event risk.
- Education: our option trading course covers practical structures and adjustments.
Comparison quick view
| Type | Holding Period | Key Inputs | Typical R:R | Proxima Support |
|---|---|---|---|---|
| Intraday | Minutes–Hours | VWAP, ORB, momentum | 1:1.5–1:2 | Daily alerts, live notes |
| Swing | Days–Weeks | Breakouts, pullbacks | 1:2–1:3 | Watchlists, reviews |
| Options | Days–Weeks | Trend + IV regime | Defined risk | Course + playbook |
For broader context on designing a signal system within your education plan, see our online stock trading course.
Best Practices
Treat signals like a professional checklist. Cap risk per trade, insist on multi-factor confirmation, and log every outcome. Backtest for at least 100 trades or 5 years of data, then forward-test in small size before scaling.
Risk and trade plan
- Risk budget: 0.5%–1.0% per trade; 2%–3% max daily draw pause.
- Position sizing: compute shares from stop distance and risk budget.
- Orders: use bracket orders for auto stop + target where available.
Confirmation and filters
- Multi-factor: trend + momentum + volume beats any single indicator.
- Volatility: adapt stops using ATR(14) or recent range percent.
- Event map: mark earnings, policy days, and macro prints.
Documentation and review
- Journal: capture pre-trade plan, post-trade reality, and emotion score (1–5).
- Metrics: track win rate, average R, max drawdown, and expectancy.
- Iteration: retire low-edge setups; expand high-edge patterns.
Upgrade your indicator playbook with our piece on technical indicators for spotting trends faster.
Tools and Resources
You need three categories of tools: screening and charting, alert delivery, and journaling/analytics. Combine them into a simple daily routine that takes you from watchlist to execution and learning loops.
Screening and charting
- Screeners: trend strength, breakouts, and relative volume filters.
- Charts: EMA clouds, VWAP, RSI/MACD, and anchored support/resistance.
- Multi-timeframe: weekly context → daily bias → intraday trigger.
Alert delivery
- Real-time channels: Our signals and notes are delivered via live sessions and messaging platforms for immediate clarity.
- Message structure: Ticker, direction, entry zone, stop-loss, targets, and invalidation rules.
- Consistency: same format every time for faster recognition.
Journaling and analytics
- Template: setup type, context, trigger, risk, outcome, and notes.
- Tags: label trades by pattern; find your top-3 performers.
- Cadence: 15-minute daily review; 60–90 minutes weekly deep dive.
Market structures differ by region, so your playbook must account for liquidity, regulation, and market hours. For a global perspective on adapting strategies, see this discussion of global market context.
Want a second pair of eyes on your plan?
Our team at Proxima Learning can review your signal checklist, risk parameters, and journaling routine. We’ll suggest practical tweaks you can apply this week.
Education • Real-time alerts • Portfolio reviews
Case Studies and Examples
These mini case studies show how rules-based signals translate to real trades. Each example highlights the setup, entry, risk plan, management, and result—so you can model the behavior, not just the theory.
Example 1: Intraday opening range breakout (ORB)
- Setup: strong premarket trend and news; clean opening range.
- Trigger: 5-minute ORB with volume ≥ 150% of average.
- Plan: risk 0.5%; stop below range; scale out at +1R, +2R.
- Result: two partials banked; trailed remainder to VWAP.
Example 2: Swing pullback to rising 20/50 EMA
- Setup: multi-week uptrend; pullback on lighter volume.
- Trigger: bullish engulfing on daily with RS line near highs.
- Plan: risk 1%; initial target at prior high; trail for extension.
- Result: 1:2 achieved; runner trailed using ATR stop.
Example 3: Options—bull call debit spread on breakout
- Setup: base breakout with rising volume; IV moderate.
- Trigger: daily close above resistance; next-day continuation.
- Plan: defined max loss; target spread’s max value zone.
- Result: closed at 65% of max value after momentum stall.
Example 4: Earnings season filter
- Setup: strong chart but earnings within 48 hours.
- Rule: skip or switch to defined-risk options.
- Outcome: avoided a gap-down that would have hit stop.
Example 5: Breakout failure—journal gold
- Setup: textbook breakout; false move after news reversal.
- Plan: honored stop at −1R; re-entered later with tighter risk.
- Lesson: pattern quality ≠ trade quality without context and catalyst.
We share similar walkthroughs in live sessions and in our technical analysis explained content, so you can compare notes with an expert lens.
Frequently Asked Questions
Our FAQ addresses common questions about building, using, and improving trading signals—from time commitment and tools to risk rules and performance measurement. Each answer is concise and actionable so you can apply it right away.
How many indicators should I use to confirm a trading signal?
Use a simple, multi-factor mix: one trend tool, one momentum or volume tool, and a structure cue like support/resistance. More indicators don’t guarantee better trades—clarity and repeatability do. Backtest your exact combo for at least 100 trades before committing.
What’s a reasonable risk per trade when following alerts?
Many disciplined traders cap risk near 0.5%–1.0% of account equity per trade and pause the day around 2%–3% drawdown. The goal is staying in the game long enough to let your edge show. Adjust sizing to volatility and your comfort.
Can I use trading signals part-time?
Yes. Pick swing or options signals that fit a daily or weekly review cycle. Automate alerts, pre-plan at night, and execute with bracket orders. A 30–45 minute daily routine plus a 60–90 minute weekend review is workable for many part-time traders.
How do Proxima Learning’s alerts differ from generic tips?
Our alerts are education-forward and always include entry, targets, and stop-loss guidance. We explain the setup and risk logic so you understand the “why,” not just the “what.” Plus, portfolio reviews and courses help you integrate signals into a complete plan.
Conclusion & Next Steps
Trading signals work best inside a simple, repeatable routine: screen, plan, trigger, manage, review. Keep risk small, insist on clarity, and let data guide improvements. Education plus real-time notes and periodic reviews accelerate your learning curve.
- Key actions: write your checklist, define risk limits, and log 100 trades.
- Keep learning: explore our online stock trading course next.
- Extend skills: add options structures via our option trading course.
- Stay current: follow our trading signals for today stream.
Want to build professional habits around execution? This short read on creating repeatable analysis rhythms offers practical reminders for structured work in analytical roles. Different field, same discipline.