
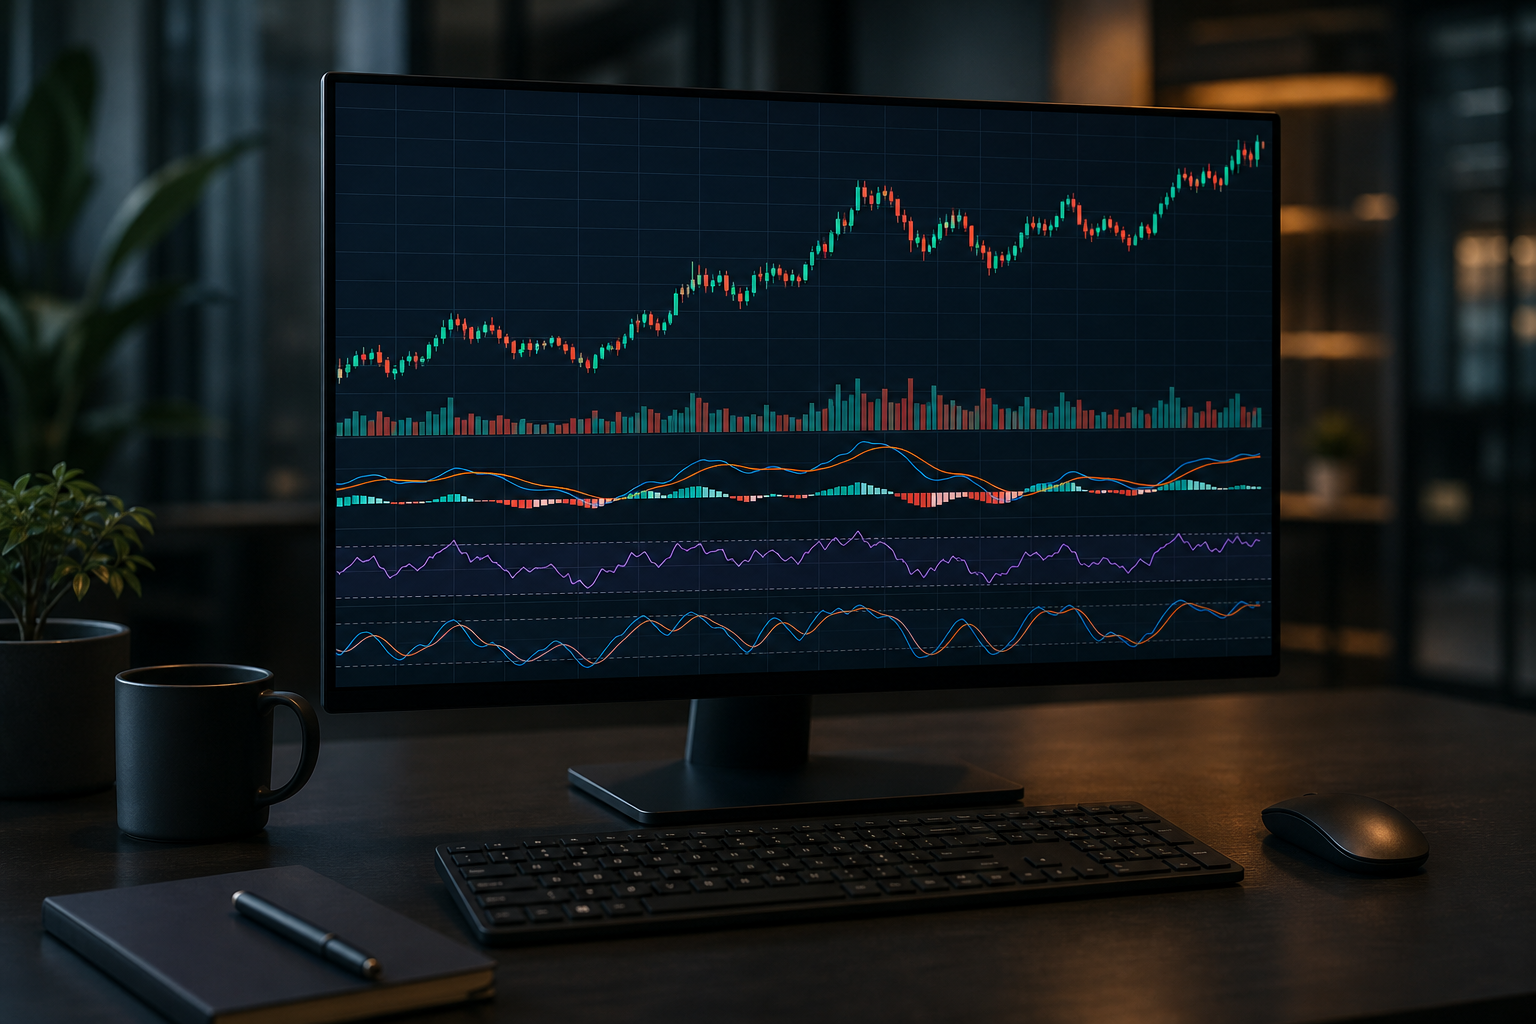
Technical indicators explained
What is a technical indicator?
A technical indicator is a heuristic or pattern-based signal derived from market data—most commonly price, volume, and open interest—that traders use to interpret past action and identify potential entry and exit opportunities. This follows standard definitions in technical education: indicators transform raw market inputs into readable metrics that highlight trend strength, momentum, volatility, or range extremes (Investopedia: technical indicator; Investopedia: technical analysis).
Practical purpose: indicators simplify price and volume history into signals a trader can codify into rules for entries, stops and targets. Traders typically combine indicator signals with chart structure and strict risk rules so decisions are repeatable rather than ad-hoc.
Common indicators and what they tell you
Below are concise, example-driven notes on indicators traders use most often—what each measures, how to read typical signals, and the setups they commonly suit.
- Moving averages (MA). A moving average smooths recent price to reveal trend direction. A crossover—one MA crossing another—is a simple signal often used to mark a potential trend change or continuation (Investopedia: moving average crossovers).
- Relative Strength Index (RSI). RSI is a momentum oscillator that compares recent gains to losses and produces a 0–100 value. Readings near the top suggest overbought conditions; readings near the bottom indicate oversold conditions. Traders also watch divergence between RSI and price for reversal clues (Investopedia: top indicators).
- Moving Average Convergence Divergence (MACD). MACD is built from differences between exponential moving averages to highlight shifts in momentum. Common signals are MACD line crossovers of its signal line and histogram changes that show acceleration or deceleration in momentum (Investopedia: MACD primer).
- Bollinger Bands. These form volatility envelopes around a moving average. Price touching or riding the bands signals strong momentum or expanded volatility; tight bands often precede volatility expansions. Traders use bands to spot breakouts and measure regime changes (Investopedia: top indicators).
- Oscillators. Oscillators fluctuate between bounds and are useful for identifying range extremes and short-term momentum. When an oscillator nears its upper bound analysts often consider the asset overbought; near the lower bound they consider it oversold (Investopedia: oscillators).
How indicators are constructed from price and volume
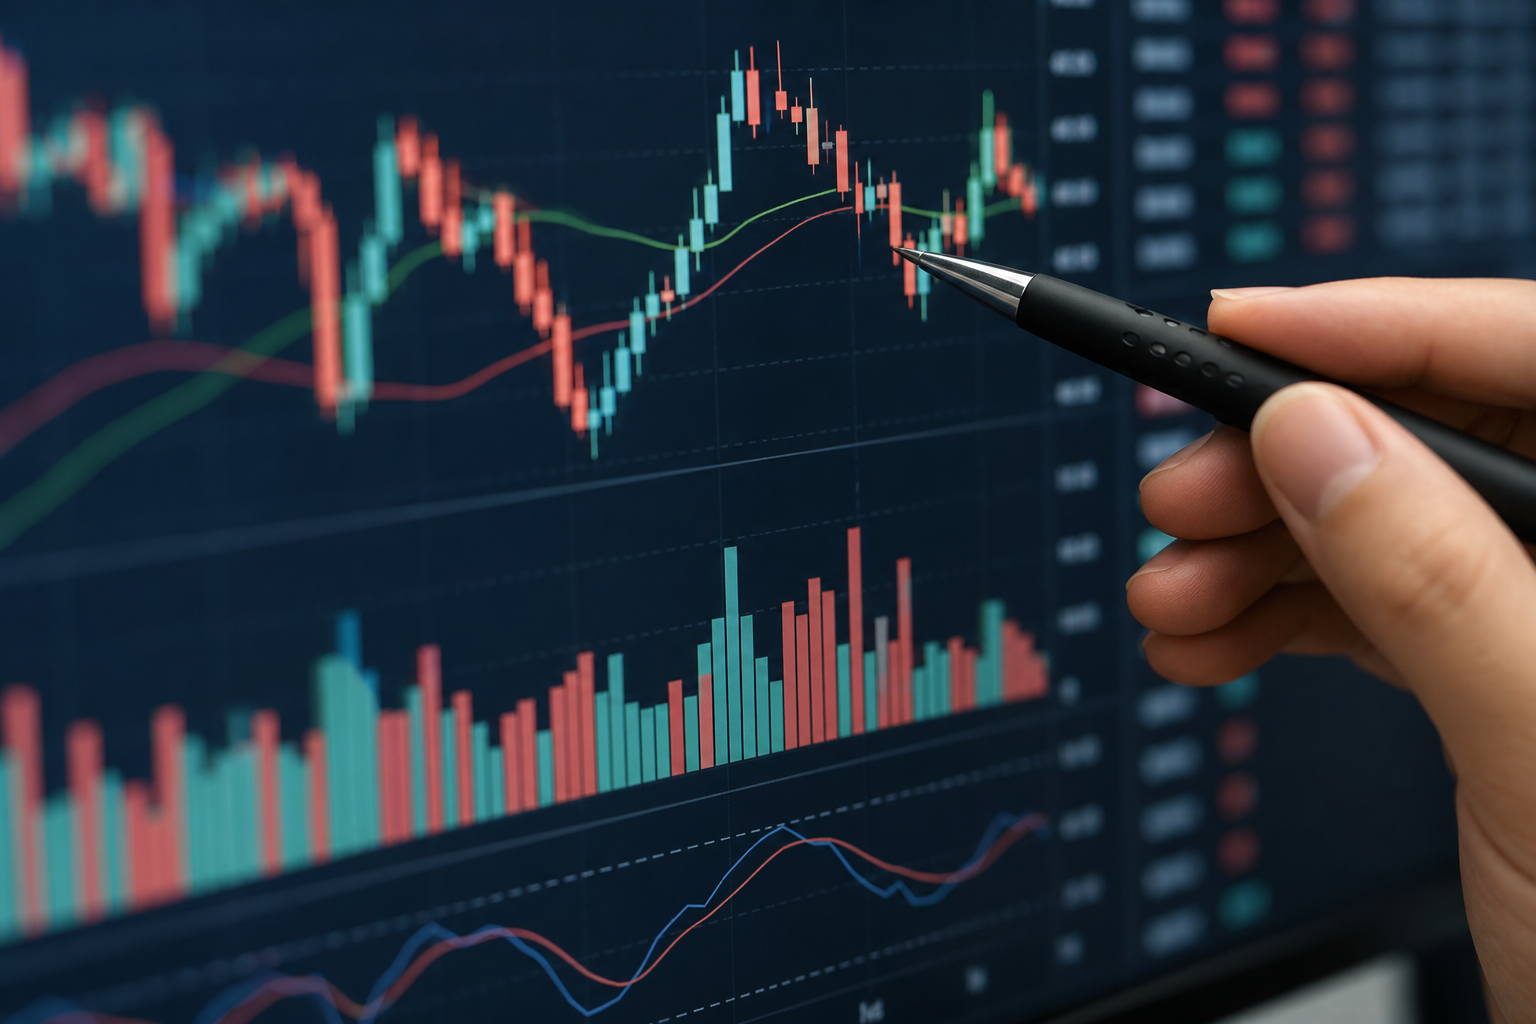
Indicators are mathematical functions applied to market inputs. A few common construction methods illustrate why indicators behave differently:
- Moving averages smooth price by averaging recent values. A simple moving average (SMA) is an arithmetic mean of the last N closes; an exponential moving average (EMA) weights recent prices more heavily so it reacts faster to new information.
- Some indicators derive differences of smoothed lines. MACD subtracts a longer EMA from a shorter EMA so the result emphasizes momentum shifts between two timeframes (Investopedia: MACD primer).
- Oscillators scale derived values into bounded ranges. RSI uses average gains and losses over N periods to create a 0–100 index where extremes imply overbought or oversold status (Investopedia: oscillator).
- Volume-based indicators incorporate transaction size or money flow to qualify price moves; volume confirmation can distinguish moves with participation from thin, suspect moves (Investopedia: technical indicator).
Why settings matter: changing period length or smoothing alters responsiveness. Shorter periods yield more signals and more noise; longer periods give fewer, more filtered signals. Knowing the math behind an indicator clarifies when it will lag and when it might provide earlier signals, helping you choose settings that match your time horizon.
Repeatable setups: map indicator signals to entry, target and stop-loss
Indicators are most useful when translated into explicit rules. Below are three concise, repeatable templates you can paper trade. These frameworks show how to define entry, stop and target clearly; always add position sizing and risk limits before trading real capital.
-
Trend-follow crossover (moving averages).
Entry: buy when a short MA (e.g., 20-period EMA) closes above a longer MA (e.g., 50-period EMA) and price is above both MAs. Stop-loss: place below the recent swing low or below the longer MA by a fixed rule-based distance. Target: use a fixed reward-to-risk multiple (example 2:1) or trail the short MA to protect profits.
-
Momentum confirmation (MACD + trend filter).
Entry: trade in the direction of the higher-timeframe trend; enter when the MACD line crosses above its signal line for longs while price remains above a trend-defining MA. Stop-loss: set at the recent structure low or a predefined percentage. Target: a prior resistance level or a risk-multiple objective; consider scaling out (partial exit) at the first target and trailing the remainder.
-
Mean-reversion using RSI in range markets.
Entry: when RSI reaches an established oversold threshold (e.g., near 30) and price touches a predefined support zone, consider buying if price structure supports a reversal. Stop-loss: below support. Target: a prior swing high or a set reward-to-risk multiple. Use divergence (price lower, RSI higher) as stronger confirmation.
Key rule: codify stop and target before entry and size positions so a single loss fits your risk tolerance. Indicators define opportunities, not guarantees; consistent rules and risk control preserve capital in losing streaks (Investopedia: using indicators to manage risk).
Reduce noise: a simple decision flow and tools to replicate examples

Use a short decision flow to reduce conflicting signals and improve the odds that an indicator-triggered trade is meaningful:
- Trend filter: identify the dominant direction on a higher timeframe (for example, daily) using moving averages or price structure.
- Momentum confirmation: require a momentum indicator (MACD or RSI) to agree with the trend direction.
- Entry rule: use a rule-based trigger on your trading timeframe (crossover, oscillator threshold, or price pattern).
- Risk control: set stop-loss, calculate position size by dollar risk, and set a clear target or trailing rule.
Charting tools and replication: pick a charting platform that supports indicator presets and template saves so you can reproduce setups across instruments and timeframes. If you want a structured learning path or step-by-step templates that match the setups above, consult the resource titled technical analysis explained for presets and guided lessons. For foundational context on indicator selection and interpretation, see authoritative educational references like Investopedia (Investopedia: technical analysis basics).
Frequently asked questions
Which indicators are best for spotting trend changes and which for overbought/oversold conditions?
Moving averages and their crossovers are commonly used to detect trend shifts because they smooth price and show direction. MACD is another momentum-based tool used to spot shifts. Oscillators such as RSI are designed to show overbought or oversold extremes. These roles are standard in technical education sources (Investopedia: top indicators).
How should I set a stop-loss and a profit target when trading an indicator signal?
Define stop and target rules before entry. Common approaches: stop below a recent swing low or a trend-defining moving average; target using a fixed reward-to-risk multiple (for example 2:1) or a prior structure level. Consistent position sizing is critical so a failed signal does not exceed your risk tolerance.
Why do indicators sometimes produce false signals and how can I reduce them?
False signals arise because some indicators lag (trend-following) or generate excessive signals in choppy markets (fast settings). To reduce false entries require higher-timeframe trend agreement, use momentum confirmation (MACD/RSI), and validate with volume or price structure. Paper-trading helps assess an indicator’s signal-to-noise profile for your chosen market and timeframe (Investopedia: technical indicator).
Can I rely on technical indicators alone or should I combine them with other analysis?
Indicators are tools, not guarantees. Most effective approaches combine indicators with price structure, volume context, strict risk rules, and trading discipline. Many traders also consider fundamental or macro context for larger timeframe decisions—indicators work best as part of a disciplined process rather than as an isolated oracle (Investopedia: technical analysis).